Cash buyers represented 27% of U.S. home sales in September, according to the National Association of Realtors (NAR). That’s a meaningful share, but it doesn’t mean investors are buying most homes or that buyers using mortgages have been pushed to the sidelines. The figure describes how purchases were funded, not who made them or why.
Ryan Serhant, CEO of SERHANT, has described the U.S. as several housing markets at once: cash buyers, buyers who need financing, homeowners holding low mortgage rates, and builders. Those groups face different choices and constraints, even when they’re looking at homes in the same area. The cash segment is worth a closer look because it includes people moving from one home to another, not just investors.
This is more significant than it looks. A national cash share can sound like a verdict on competition, but it leaves out the local price range, the buyer’s source of funds, and the reasons a seller might favor one offer over another.
Equity can put homeowners in the cash pool
NAR identifies three common sources of cash demand: homeowners using proceeds from a sale, second-home buyers, and investors. Those categories overlap in their effect on a transaction, but they don’t represent the same kind of demand. A homeowner selling one property and buying another may be bringing accumulated equity into the purchase rather than competing as an investor.
Cotality estimates that homeowners with a mortgage hold about $310,000 in average equity. That’s an average, not a ready-made budget for every owner. The amount available depends on the home’s value, the outstanding loan, and the price of the next home, so the figure can’t tell an individual household whether an all-cash move is within reach.
Still, equity can change the calculation for owners reluctant to trade a low mortgage rate for a new loan. Selling first may provide funds for a later purchase, though the timing and price of both transactions matter. For some households, paying cash may be possible; for others, equity may cover only part of the next home’s cost.
An all-cash purchase removes the need for mortgage approval and a monthly loan payment, and it may allow a faster closing. Those features can make an offer attractive to a seller, especially when timing and certainty matter. But paying cash doesn’t make the purchase cost disappear: the buyer still has to fund the home, and using more equity in the purchase leaves less of it available for other needs.
When equity covers only part of the next home’s cost, putting more cash toward the purchase can reduce the amount borrowed and the resulting monthly payment. That’s one reason the cash-buyer share shouldn’t be read as a simple measure of investor activity. Some buyers may be carrying wealth from a previous home into their next one. A related look at investor activity is available here.
Cash sales differ sharply by location
The national figure masks substantial local variation. Realtor.com data found cash buyers accounted for nearly 47% of sales in Mississippi and 46% in Montana earlier this year. Those figures show why the national share can’t stand in for conditions in any one state, much less a specific neighborhood or price bracket.
Realtor.com attributes differences among states to a mix of home affordability, wealth, and buyer demographics, including retirees and second-home purchasers. Each factor can shape who enters the market and how they pay. A state with more second-home activity, for example, may have a different buyer mix from one where purchases are more closely tied to local household incomes.
Cash-sale shares by state
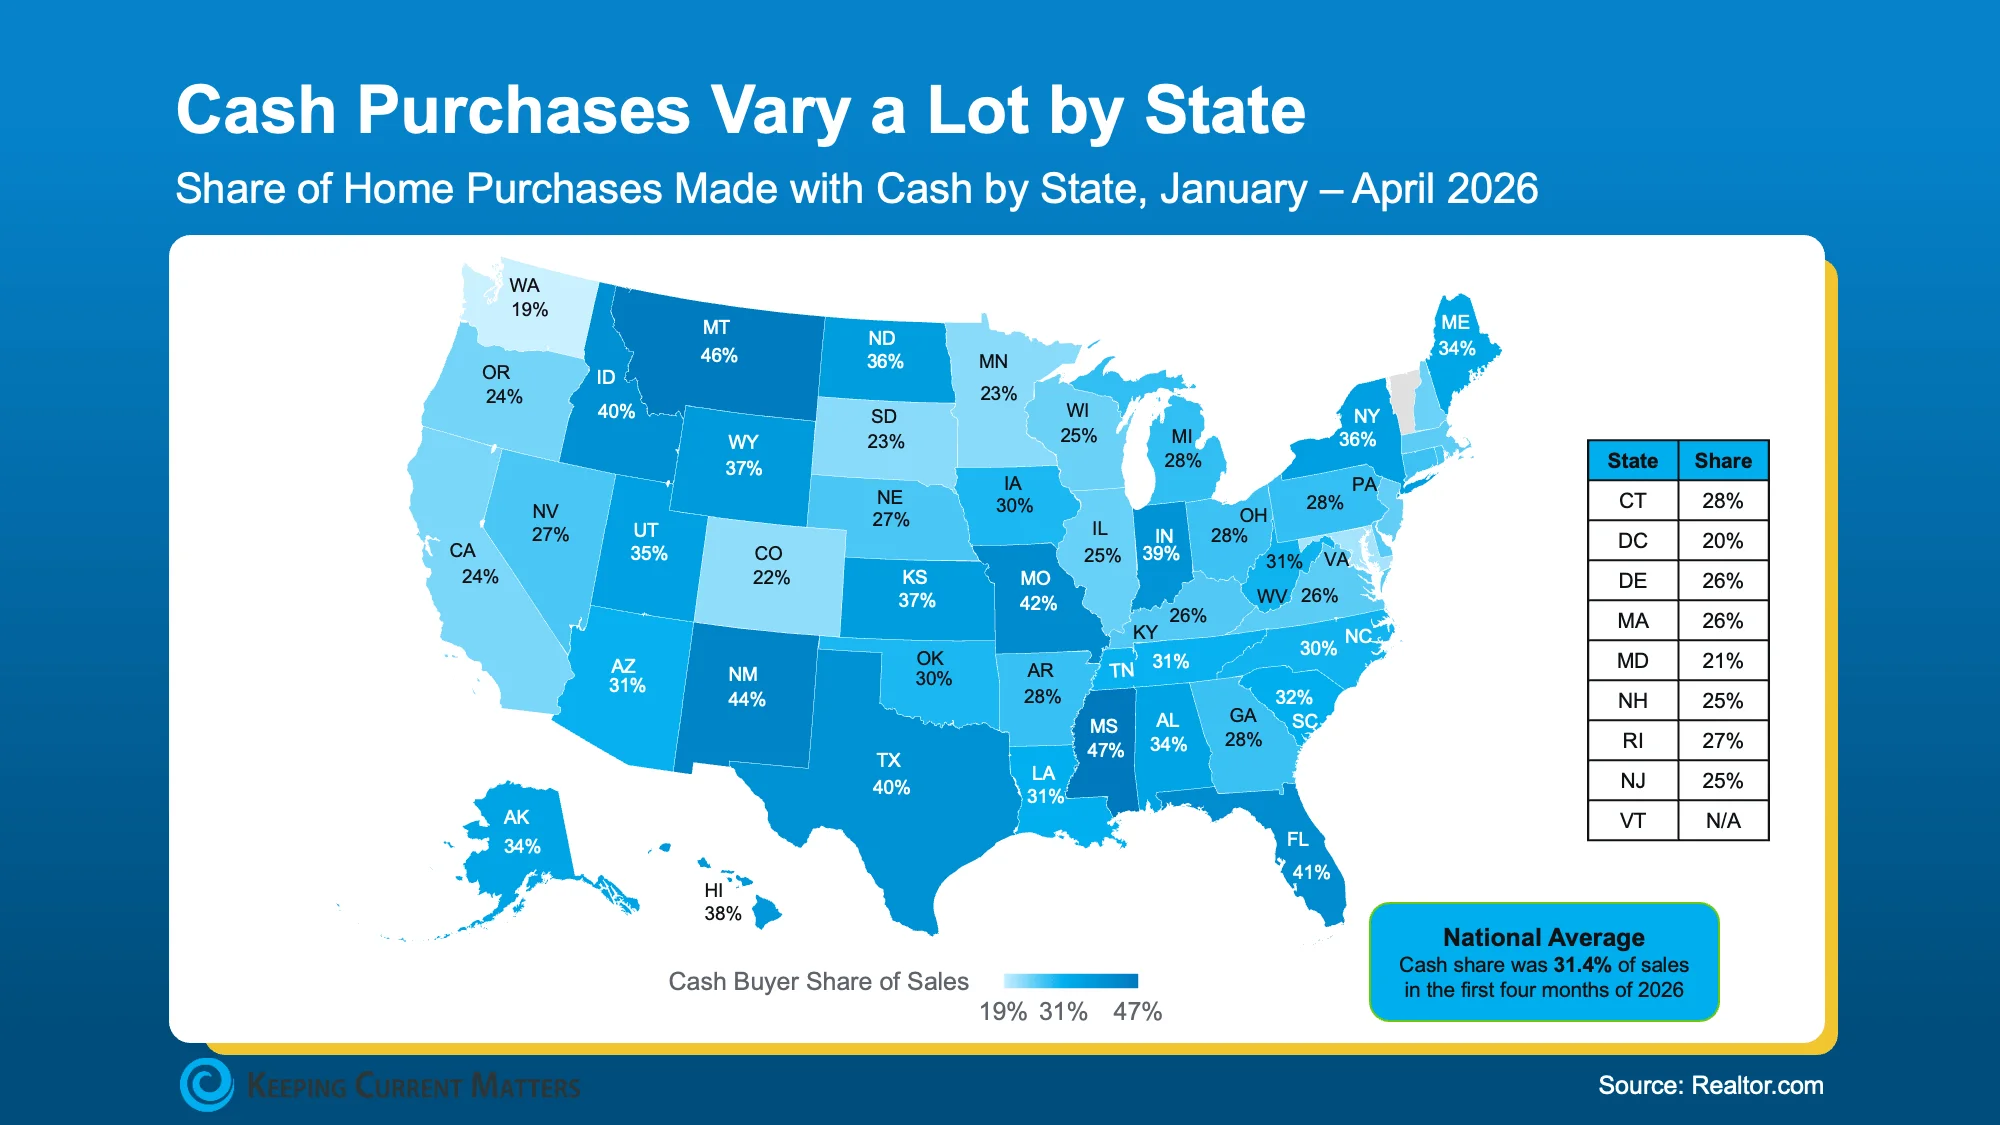
For agents and market watchers, the implication is practical: a national share can’t tell you how often cash offers appear in a particular market or how much weight sellers give them. Local prices, the homes available, and the buyers active in a given area shape the contest. If you’re working in this space, the state comparison is a starting point for questions, not a substitute for local sales data.
Mortgage buyers remain the majority
Cash sales draw attention, but NAR’s September data show that nearly three out of four purchases still involve financing. In the $200,000 to $750,000 range, only about one in five homes sold for cash, according to Realtor.com data. The price-band figure matters because it gives a more specific view of where many financed buyers are active than the national cash share does.
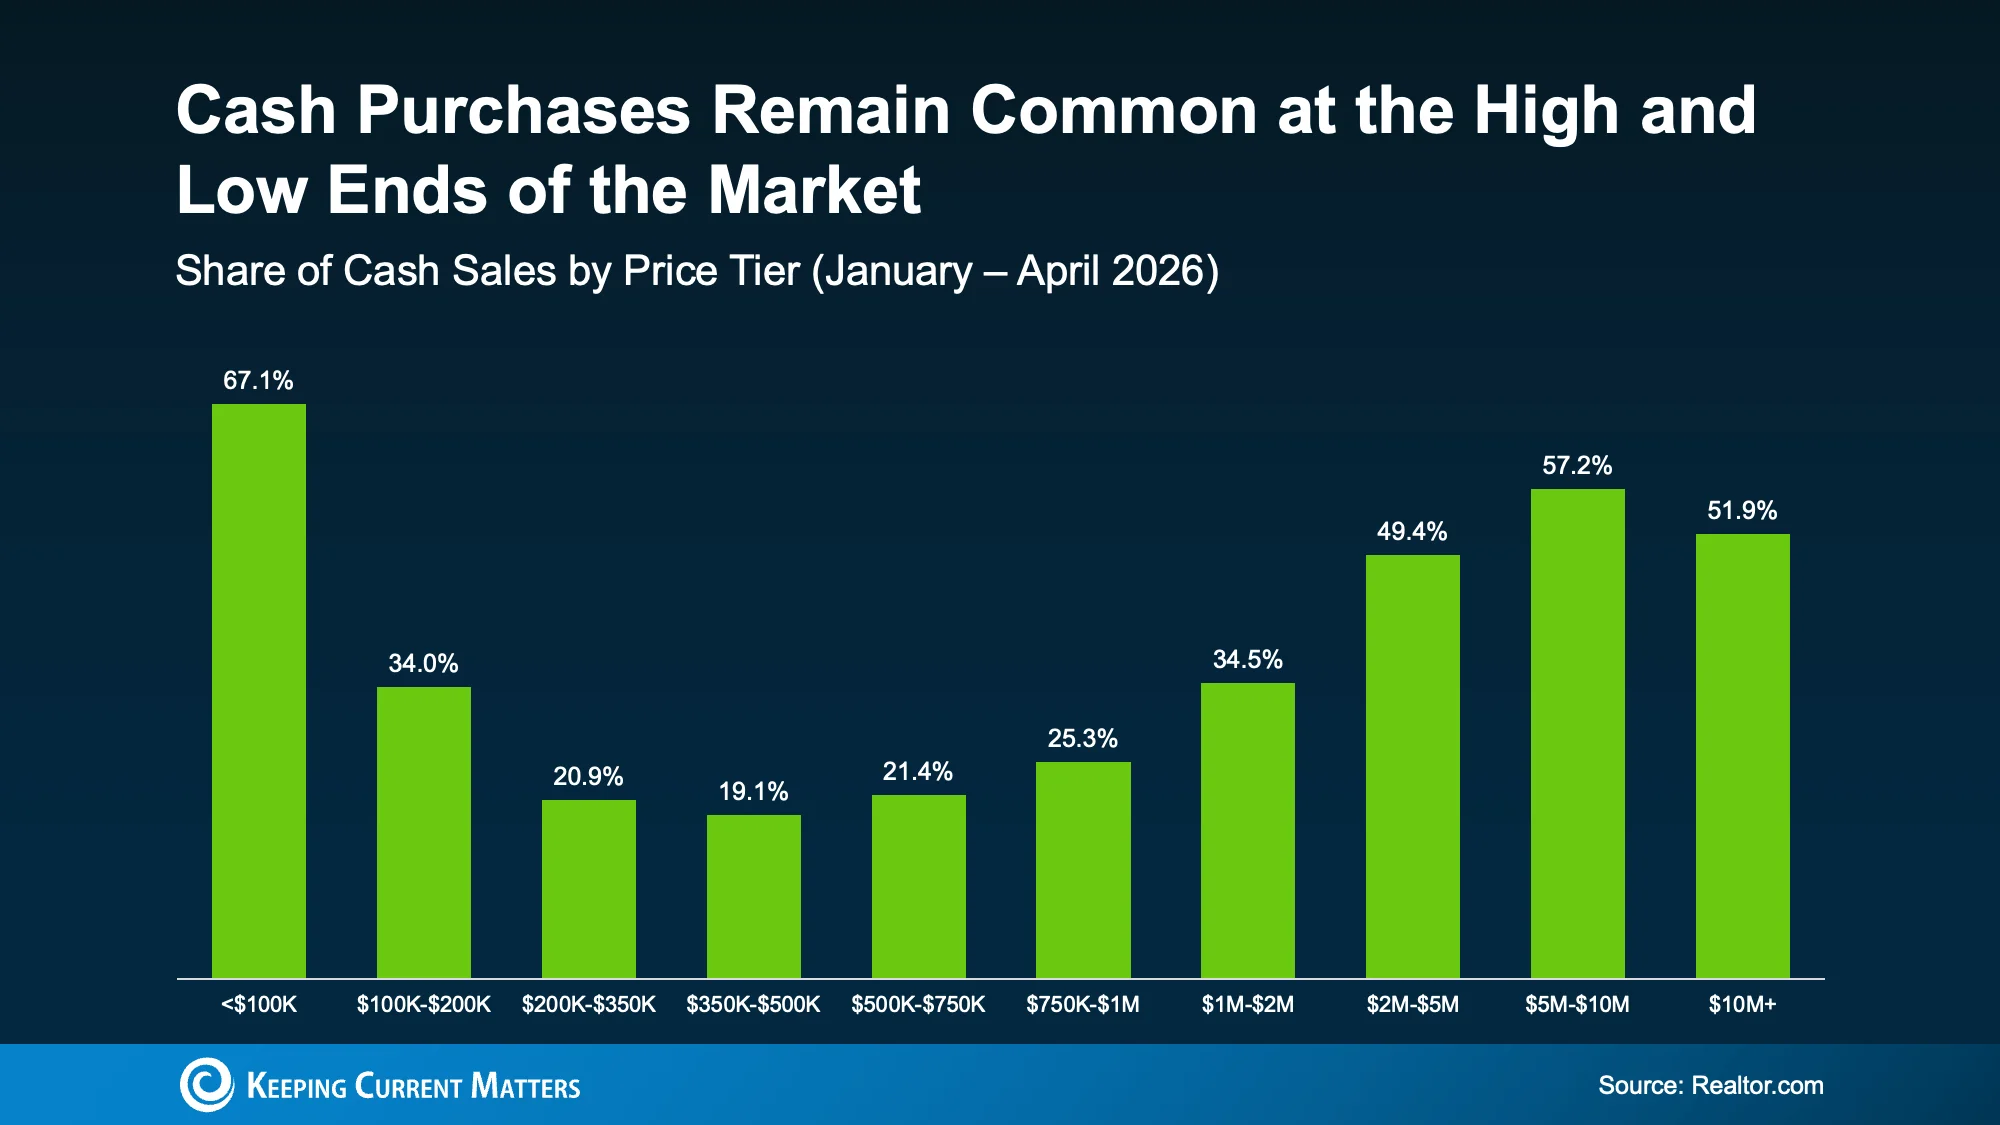
So buyers relying on mortgages remain in the main body of the market, particularly across that broad mid-price range. A mortgage buyer may still face competition from cash purchasers, but the national numbers don’t support treating cash as the default for every sale. The cash share matters; it just doesn’t describe every buyer’s circumstances or set the terms in every local market.
What the buyer mix means for the next move
For homeowners considering a move, the equity they’ve built may offer more flexibility than they expect, though the average figure can’t predict what any one household can spend. For buyers using financing, the national and price-band figures show they’re far from alone. The useful question is how cash demand, prices, and available homes line up in the specific area and price range they’re watching.
And yet. A headline percentage can make a varied market look simpler than it is (and this is the part most people overlook): cash purchases include different kinds of buyers, while mortgage buyers remain the majority nationally. The local mix is what turns that broad statistic into useful context.
Cash buyers are a substantial slice of the market, but most purchases still involve a mortgage. For a household weighing a sale and a purchase, the amount of usable equity and the conditions in its target market will say more than the national headline. That’s the more grounded way to read the figures.