The U.S. housing market doesn’t move as one. National asking prices have softened since summer, while sale prices in some major cities are still rising and others are edging down. For buyers and sellers, the local picture matters more than a national headline. That gap reflects a basic feature of housing: homes are bought and sold in specific neighborhoods, with different prices, property types and pools of buyers. A national figure can describe the direction of a broad measure, but it can’t tell you what’s happening on the block where you’re looking.
Seasonal cooling is showing up in asking prices
HousingWire Data puts the national median asking price at $435,000, down from $449,000 in early August. That’s a decline of about 3% over two months. The figure tracks what sellers are asking, not the final prices buyers agree to pay, so it’s best read as a signal about listing conditions. It may reflect sellers adjusting expectations as the market changes, but it doesn’t establish how much sale prices have moved.
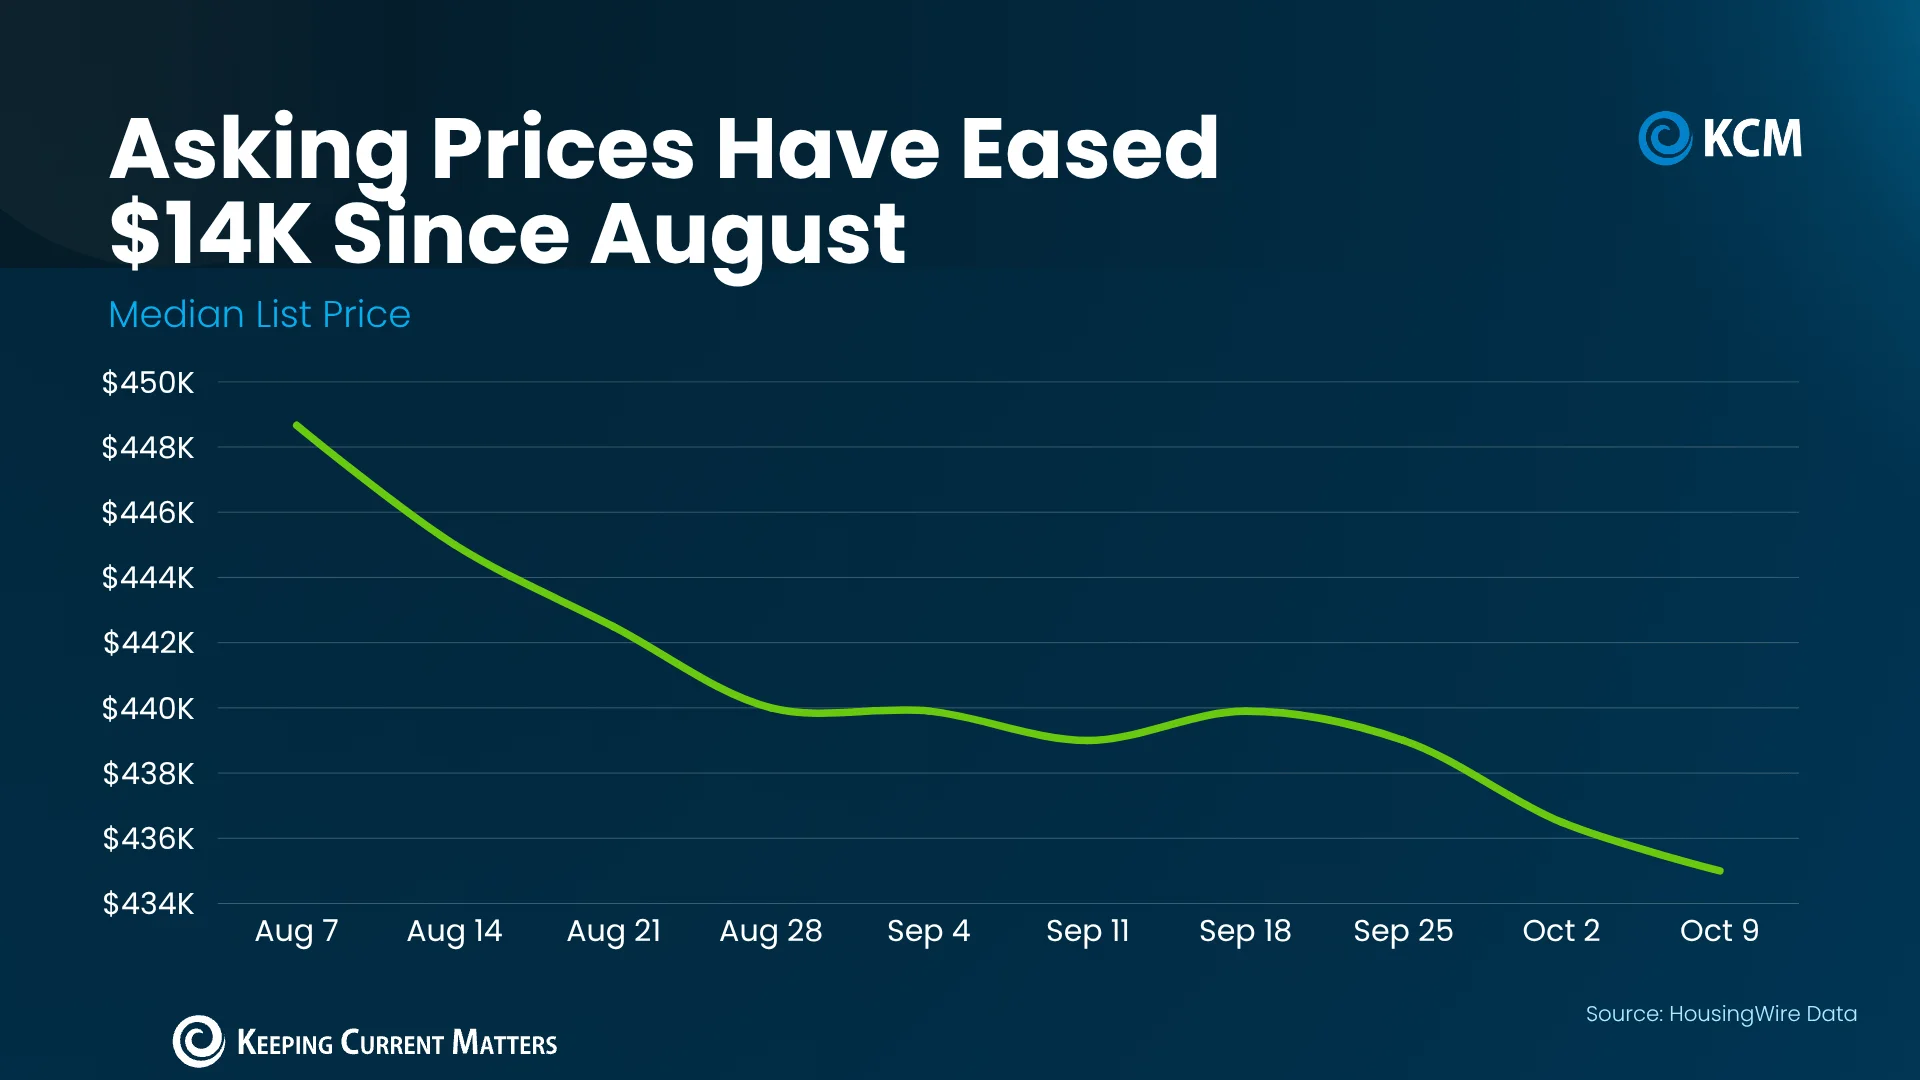
The dip has two clear pressures behind it. More homes are on the market than at any point since November 2019, and mortgage rates have risen since spring, stretching the time some properties take to sell. When buyers have more listings to consider and financing costs are higher, sellers may face stronger pressure to price competitively. That doesn’t mean every home will sit or every seller will cut the asking price; demand and competition can vary sharply by location and property.
There’s also a seasonal pattern: prices often ease after the summer selling season, when buyer activity typically slows. The national median captures that shift, but it doesn’t tell you what buyers are paying in a particular neighborhood. Asking prices and completed sale prices are different measures, too. A change in the median can also reflect which homes are listed at a given time, as well as changes in what sellers ask for similar properties. Here’s the thing: a lower median is useful context, but it’s not a direct measure of what an individual home is worth.
City-level sale prices tell a different story
The latest S&P Cotality Case-Shiller Index figures show how widely results can diverge. Over the year, sale prices in Chicago rose almost 7%, while Seattle prices fell about 1.6%—a gap of nearly nine percentage points between two large markets. These are year-over-year changes in completed sale prices, a different measure and time frame from the national asking-price figures above. The contrast shows why national summaries can obscure what’s happening in individual markets.
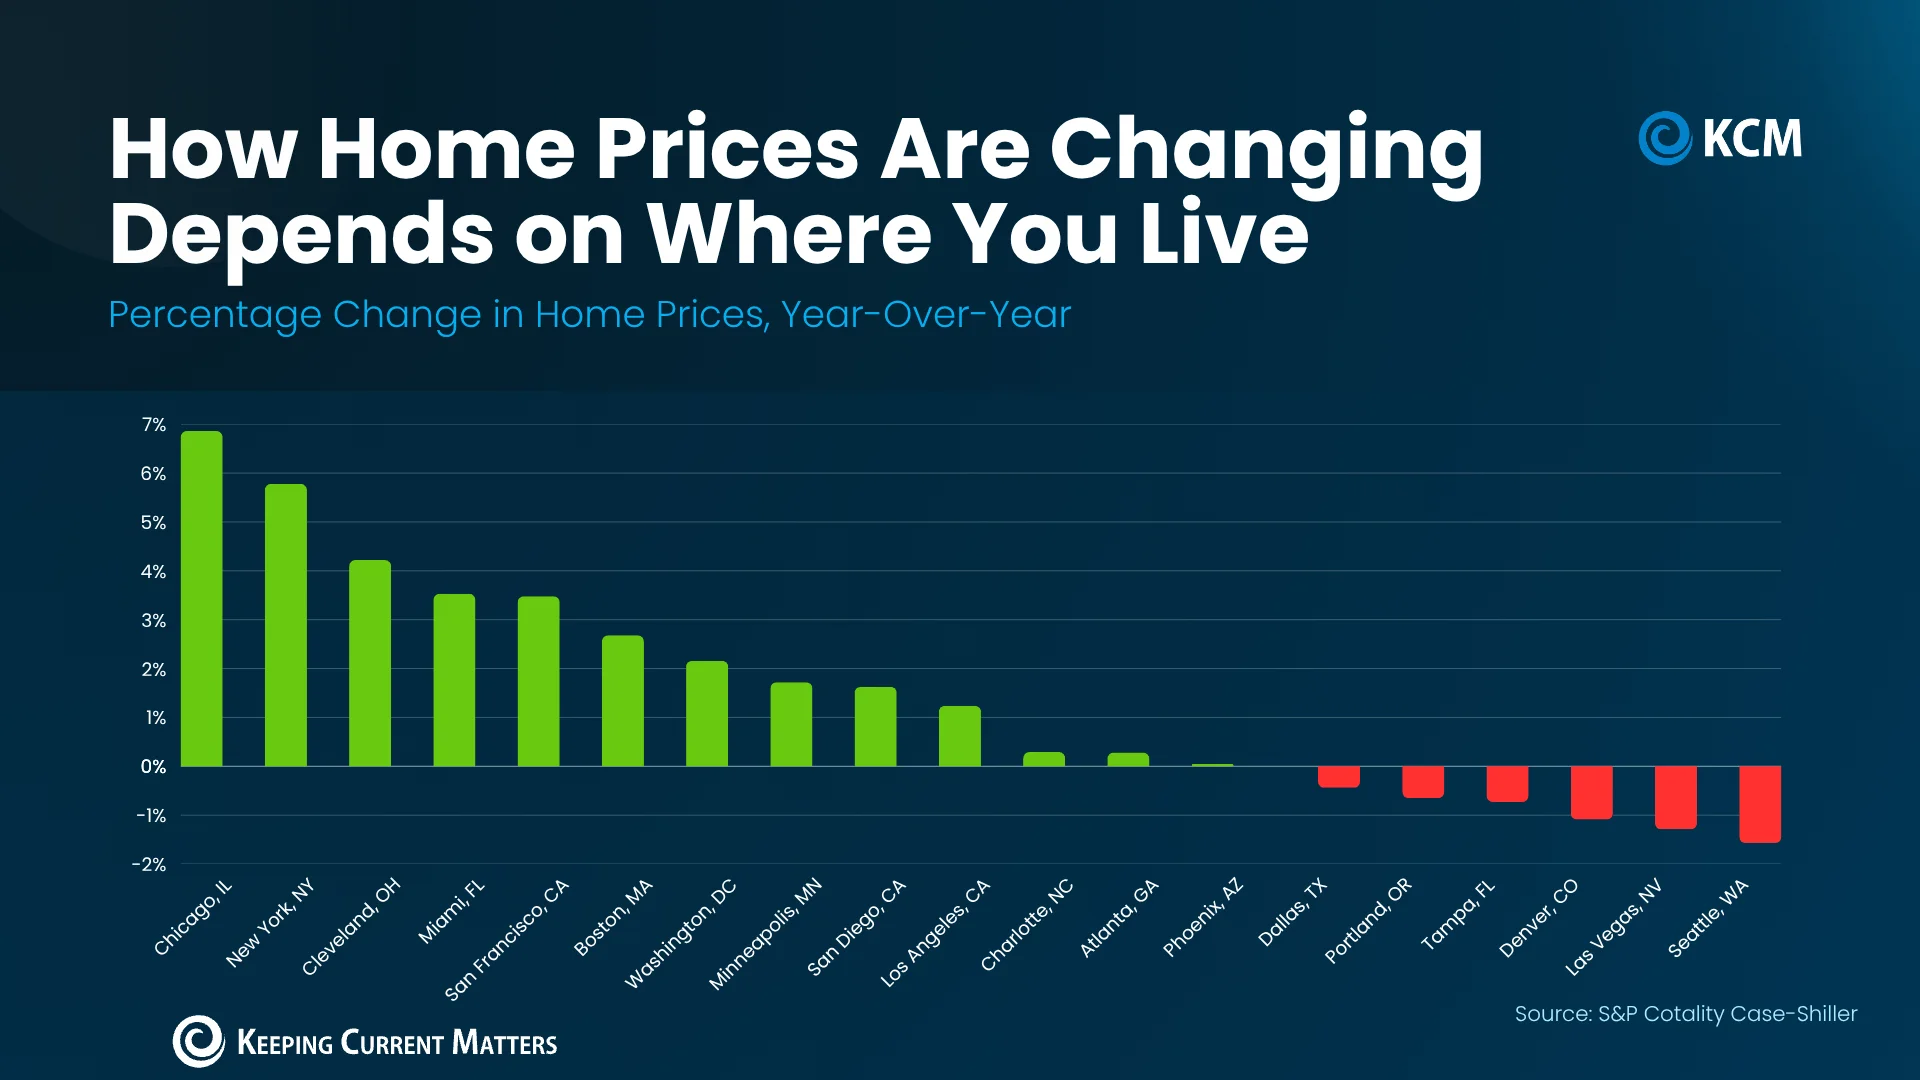
New York prices climbed almost 6%, while buyers in Denver or Las Vegas may find more room to negotiate, according to the source’s comparison. Those differences can change pricing and offer strategies; a national trend alone can’t establish whether a home is overpriced or how much bargaining room a buyer has. The comparison is a starting point, not a substitute for looking at recent sales of similar homes in the same area. A citywide index can still cover neighborhoods and property types with very different conditions.
“While national headlines might suggest a buyer’s market is taking hold, the reality on the ground depends heavily on where and what you’re trying to buy. Local trends can diverge sharply from national averages, especially when you factor in price range, property type, and post-pandemic market dynamics.”
That’s the central point in Realtor.com’s assessment: location, price range and property type all shape the market a buyer or seller actually faces. A buyer looking at one type of home may encounter different competition from someone shopping in another price range, even within the same city. The headline figures can point to a broad shift, but they don’t answer the practical questions about a particular listing.
Small declines don’t equal a broad downturn
Even in major metros where prices have declined, the drops are 2% or less, according to the source. More cities recorded gains than losses in the data shown. That spread doesn’t resemble the scale of the 2008 housing crash. Still, a modest national or citywide decline can matter to a household making a large purchase, and the small size of the reported changes doesn’t mean every seller has the same experience. The numbers here are underwhelming as evidence of a broad collapse, but they don’t erase local weakness.
Longer-term figures offer another frame. The Federal Housing Finance Agency reports national home prices have risen year over year in every quarter since 2012. Its historical index indicates that a home worth $100,000 in 1991 would be valued at about $436,000 today, with the 2008 downturn included. That long view puts current changes in context, but it can’t show how much a given home or neighborhood has gained or lost. An index summarizes a broad set of prices; it isn’t a forecast for the next sale.
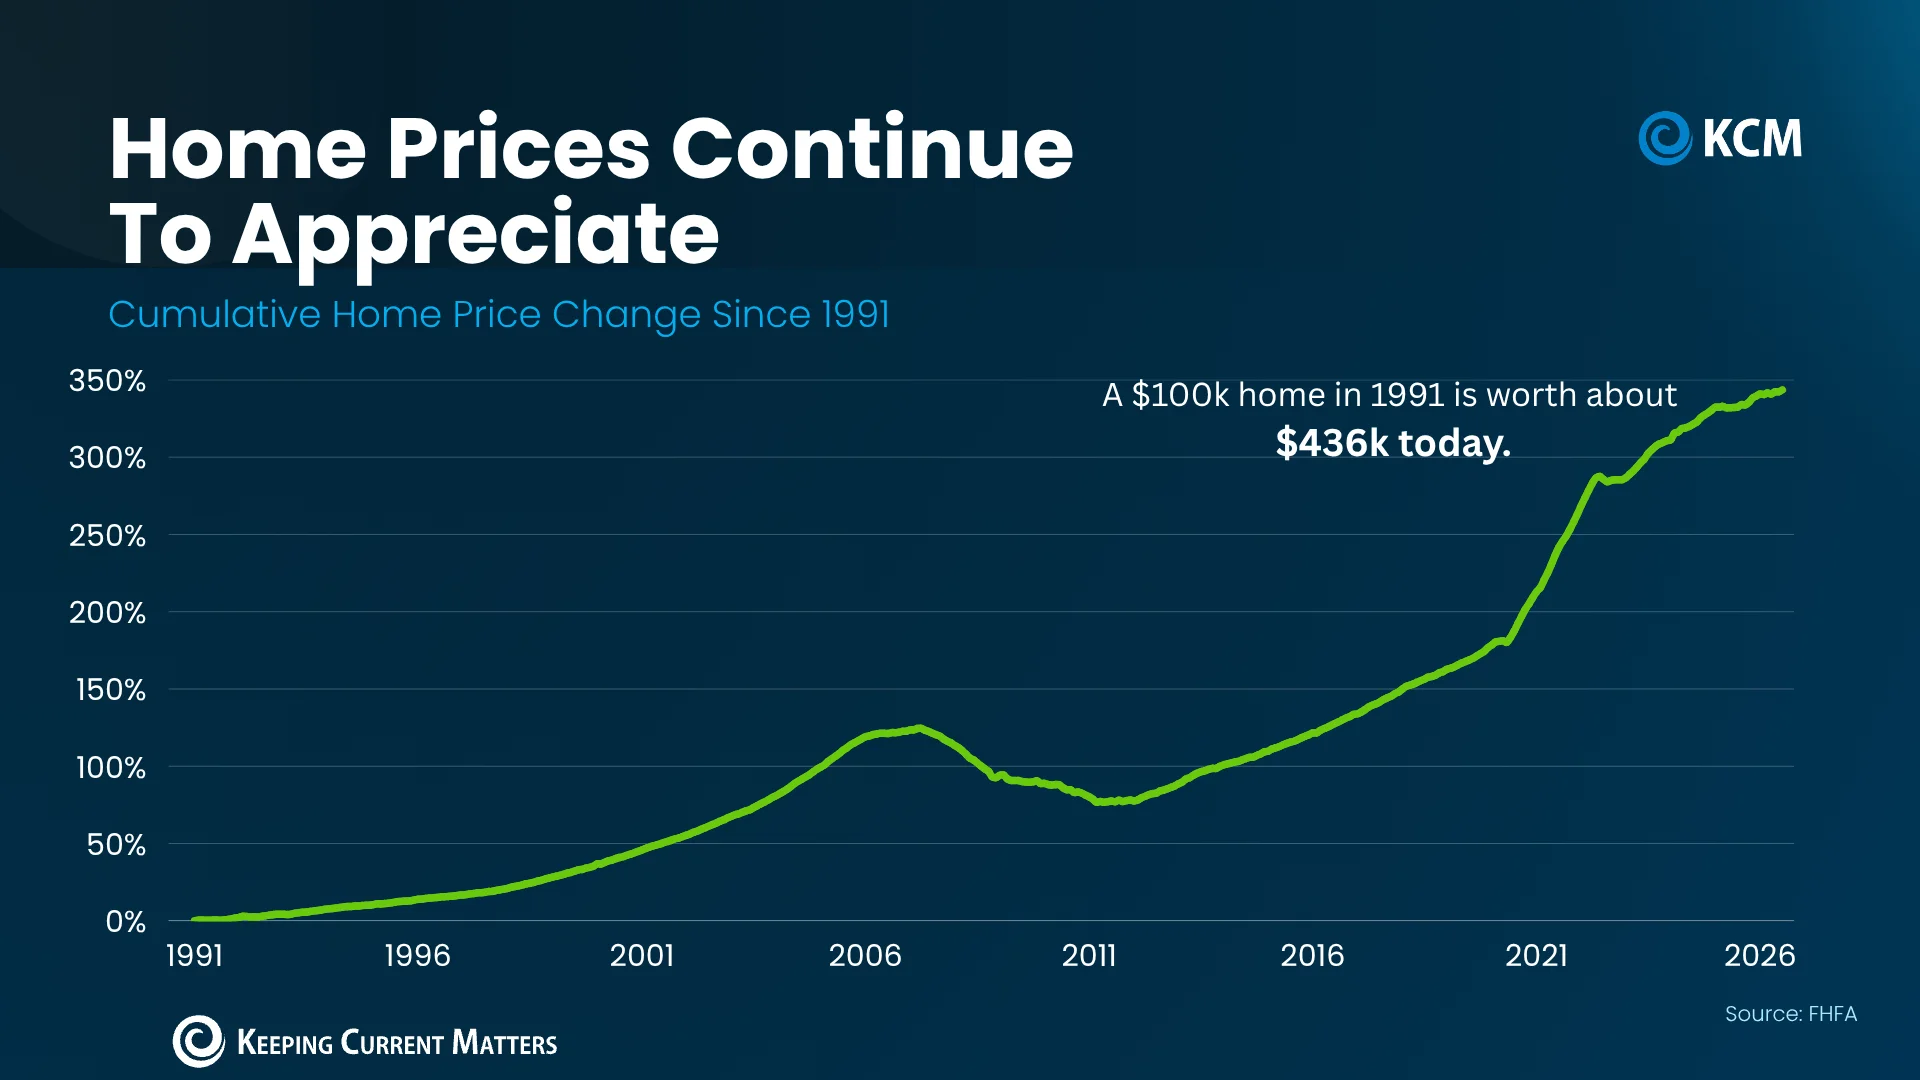
The source attributes some recent declines to markets that overheated during the pandemic. Whether a particular area is still correcting, stabilizing or gaining ground requires local sales data. For pricing a listing or evaluating an offer, the useful comparison is nearby homes of a similar type and price range, not the national asking-price median. If you’re working in this space, the distinction between listing trends and completed sales is worth keeping in view when explaining a market shift to clients. Similar housing markets can show different outcomes as buyer demand, available homes and financing costs change.
What the figures mean for buyers and sellers
For buyers, a softer national asking-price median doesn’t automatically translate into a discount on the home they want. The city-level figures suggest some markets remain stronger than others, while the comparison points to more room to negotiate in Denver or Las Vegas. That said, the amount of room depends on the property and its local competition. A citywide trend can help frame expectations, but nearby comparable sales and the details of the listing are more useful when considering a specific offer.
Sellers face a similar need for precision. A national decline may be a reason to review a listing price, especially if a home is taking longer to sell, but it isn’t enough on its own to set that price. Conditions can differ by property type and price range, even within the same city. (And this is the part most people overlook.) Asking-price movement, sale-price movement and the pace of transactions are related signals, but they don’t tell the same story.
The broader picture is mixed: seasonal cooling and higher mortgage rates are weighing on some asking prices, yet the reported sale-price changes vary considerably by city and most declines in the cited major metros are limited. The available figures support caution about broad claims of either a buyer’s market or a renewed surge. Local evidence matters most.