August’s manufacturing orders rose sharply year over year and month over month, but the sector’s monthly leaders weren’t the same as its annual ones. That split matters: the broad annual advance suggests demand has held up, while the latest monthly gains were concentrated in a few categories.
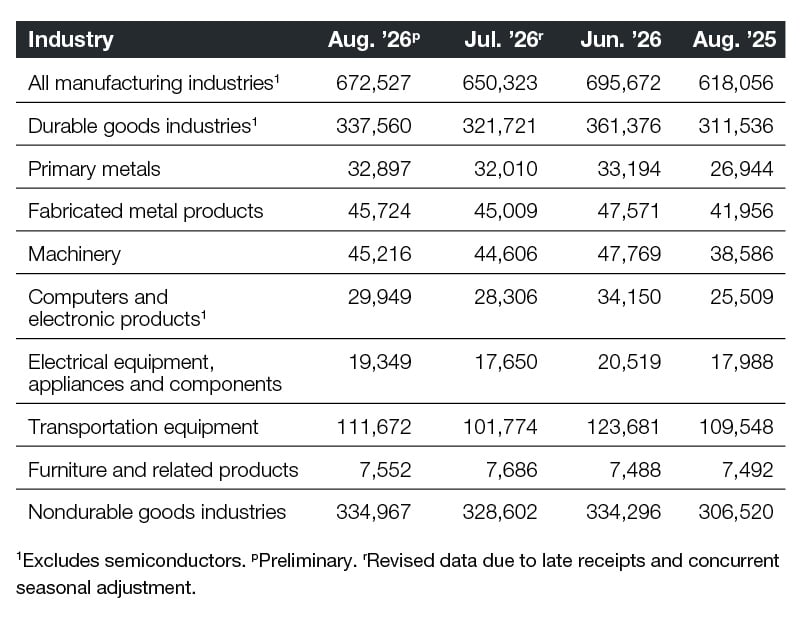
U.S. Census Bureau data show total manufacturing orders in August were up 8.8 percent from a year earlier, a $54.5 billion increase. Every tracked sector posted an annual gain. Primary metals led at 22.1 percent, followed by computers and electronic products at 17.4 percent and machinery at 17.2 percent. Nondurable goods orders rose 9.3 percent, fabricated metal products gained 9.0 percent and durable goods advanced 8.3 percent.
The remaining annual increases were smaller: electrical equipment, appliances and components rose 8.0 percent, transportation equipment gained 1.9 percent, and furniture and related products edged up 0.8 percent. Those last two figures are a reminder that the overall strength was uneven.
READ ALSO: Is Entitlement Risk Reshaping Industrial Development?
August month-over-month changes
Against July, manufacturing orders climbed 3.4 percent, or $22.2 billion. Transportation equipment made the largest positive contribution, with orders up 9.7 percent. Electrical equipment, appliances and components followed at 9.6 percent, while computers and electronic products rose 5.8 percent and durable goods gained 4.9 percent.
Other monthly gains were more restrained: primary metals increased 2.8 percent, nondurable goods 1.9 percent, fabricated metal products 1.6 percent and machinery 1.4 percent. Furniture and related products was the sole tracked subsector to fall, down 1.7 percent.
—Posted on October 26, 2026
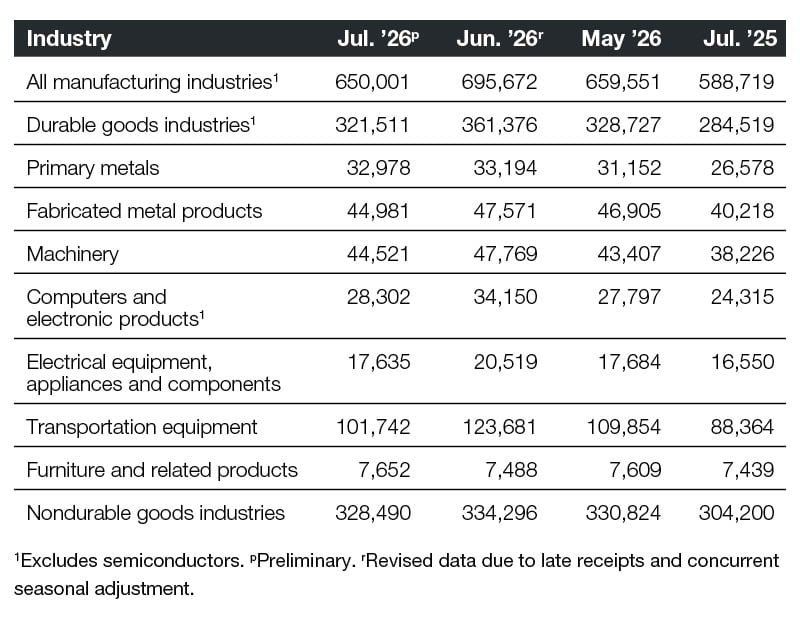
July’s annual figures were stronger than August’s: manufacturing orders rose 10.4 percent from July 2025, adding $61.3 billion, with gains across every tracked subsector. Primary metals advanced 20.7 percent; machinery, 16.5 percent; and computers and electronic products, 16.4 percent. Transportation equipment grew 15.1 percent, while durable goods increased 13.0 percent.
Fabricated metal products gained 11.8 percent year over year, nondurable goods rose 8.0 percent, and electrical equipment, appliances and components increased 6.6 percent. Furniture and related products had the smallest gain, at 2.9 percent. Broad annual growth, however, didn’t prevent a steep monthly reversal.
READ ALSO: Does Industrial Demand Foreshadow New Development?
July month-over-month changes
From June to July, total orders fell 6.6 percent, or $45.7 billion. Furniture and related products was the only tracked category to rise, up 2.2 percent. Nondurable goods slipped 1.7 percent, and primary metals fell 3.4 percent.
The declines deepened in several durable goods categories: fabricated metal products fell 5.4 percent, machinery 6.8 percent and durable goods overall 11.0 percent. Electrical equipment, appliances and components dropped 14.1 percent. Computers and electronic products declined 17.1 percent, while transportation equipment posted the steepest fall, at 17.7 percent.
—Posted on September 23, 2026
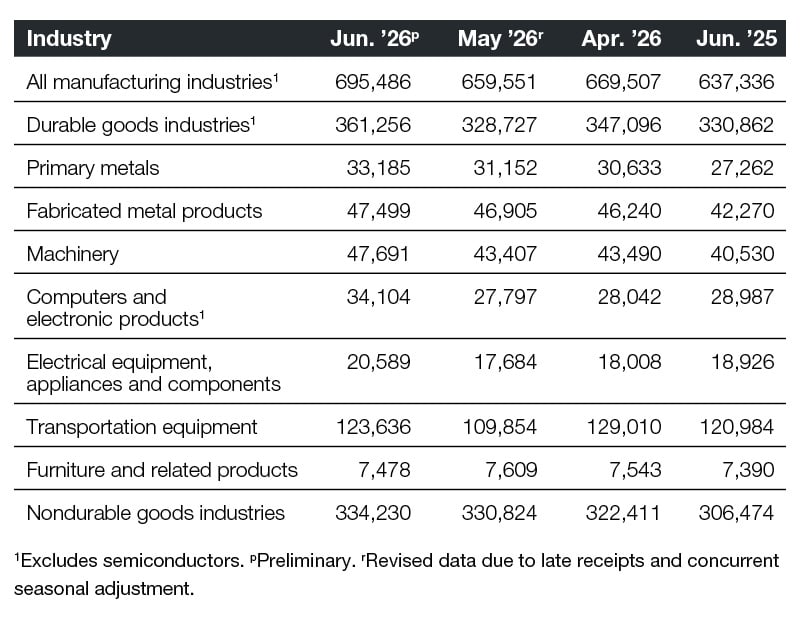
June orders were 9.1 percent higher than a year earlier, a $58.1 billion increase, according to the U.S. Census Bureau. Every tracked industry posted annual growth. Primary metals led with a 21.7 percent gain; machinery and computers and electronic products each rose 17.7 percent. Fabricated metal products increased 12.4 percent and durable goods advanced 9.2 percent.
Nondurable goods also rose 9.1 percent year over year. Electrical equipment, appliances and components gained 8.8 percent, transportation equipment increased 2.2 percent, and furniture and related products edged up 1.2 percent.
READ ALSO: Inside Industrial: Why Small-Bay Demands Discipline
June month-over-month changes
Manufacturing orders gained 5.4 percent from May, adding about $35.4 billion. Computers and electronic products led the tracked subsectors, surging 22.7 percent. Electrical equipment, appliances and components rose 16.4 percent, and transportation equipment gained 12.5 percent.
Machinery and durable goods each increased 9.9 percent month over month. Primary metals rose 6.5 percent; fabricated metal products, 1.3 percent; and nondurable goods, 1.0 percent. Furniture and related products was the exception, with orders down 1.7 percent.
—Posted on August 21, 2026
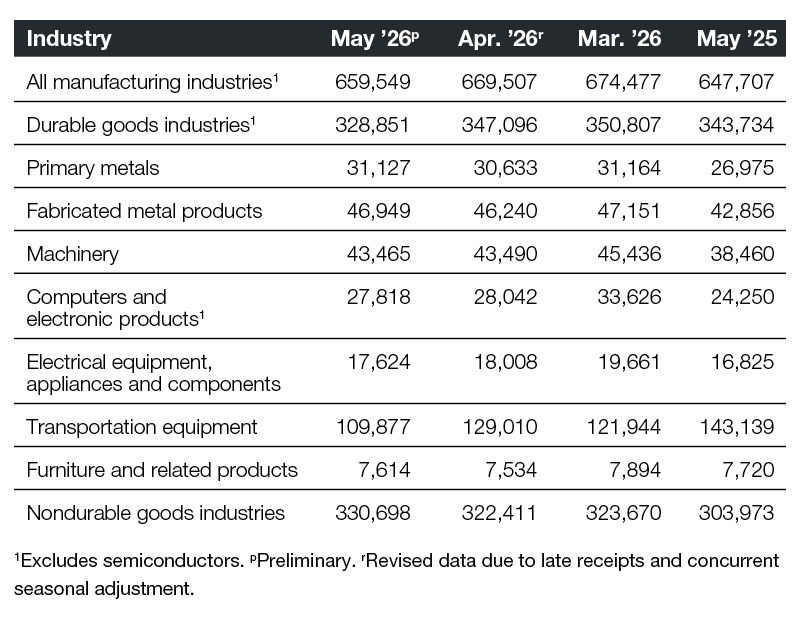
May’s annual increase was far more modest: manufacturing orders rose 1.8 percent, or nearly $11.8 billion, compared with May 2025. The headline masked substantial differences among industries. Primary metals climbed 15.4 percent, computers and electronic products gained 14.7 percent, and machinery rose 13.0 percent.
Fabricated metal products increased 9.5 percent, nondurable goods 8.8 percent, and electrical equipment, appliances and components 4.7 percent. Meanwhile, furniture and related products fell 1.4 percent and durable goods declined 4.3 percent. Transportation equipment was the weakest category for another month, down 23.2 percent year over year.
READ ALSO: Shallow-Bay CRE: Not Just for Industrial Anymore
May month-over-month changes
Orders slipped 1.5 percent from April, a decline of roughly $10.0 billion. Transportation equipment was a major drag: its orders fell 14.8 percent, more than offsetting gains elsewhere.
Nondurable goods led the monthly advances, up 2.6 percent and making the largest positive contribution. Primary metals rose 1.6 percent, fabricated metal products 1.5 percent, and furniture and related products 1.1 percent. Machinery was essentially unchanged. Computers and electronic products fell 0.8 percent, electrical equipment, appliances and components declined 2.1 percent, and durable goods dropped 5.3 percent.
—Posted on July 24, 2026
April orders rose sharply year over year, then slipped from March
The annual numbers look strong, but the monthly retreat is the more useful caution for anyone tracking industrial demand. U.S. Census Bureau data show manufacturers’ new orders were up 12 percent in April 2026 from a year earlier, a $77 billion increase. Nearly every manufacturing industry grew; furniture and related products was the exception, down about 2.6 percent.

Transportation equipment led the annual gains, jumping 39.9 percent. Durable goods orders rose 19.2 percent; computers and electronic products climbed 18.8 percent; primary metals advanced 13.8 percent; and machinery increased 11.7 percent. Nondurable goods grew 7 percent, while electrical equipment, appliances and components posted a smaller 5.8 percent rise.
Here’s the catch: total orders fell 0.7 percent from March, or roughly $5.2 billion. Transportation equipment was the only major category to increase month over month, up 5.8 percent. Computers and electronic products dropped 16.8 percent, electrical equipment and appliances fell 8.8 percent, and furniture and related products declined 4.5 percent. Machinery was down 4.3 percent; fabricated metal products, nearly 2.1 percent; primary metals, 1.7 percent; and durable goods, 1.1 percent. Nondurable goods edged down 0.4 percent.
The contrast matters: April’s annual strength was broad, but the month-to-month pullback reached nearly every sector. The data don’t explain whether that retreat marks a pause or a change in direction.
READ ALSO: Does Industrial Demand Foreshadow New Development?
—Posted on June 25, 2026
March’s rebound followed a mixed year-over-year picture
March orders surged from February, but the annual comparison was more restrained. New orders rose 3.7 percent year over year, an increase of $23.8 billion, according to the U.S. Census Bureau. Durable goods manufacturing supplied much of the annual support, though transportation equipment moved in the opposite direction.

Computers and electronic products recorded the strongest annual increase among the listed subsectors, up 14.1 percent. Primary metals gained 11.7 percent, fabricated metal products 8.1 percent, machinery 7.6 percent, and electrical equipment, appliances and components 7 percent. Nondurable goods advanced 4.6 percent, ahead of the overall figure, while durable goods rose 2.8 percent. Furniture and related products added just 0.9 percent. Transportation equipment was the sole major category with an annual decline, down 7.1 percent.
Then came a sharp monthly snapback: orders climbed 16.5 percent from February, or about $95.3 billion. Transportation equipment led with a 24.2 percent increase. Durable goods rose 18 percent and nondurable goods 14.8 percent. Fabricated metals, computers and electronic products, and machinery each gained 13.9 percent; electrical equipment, appliances and components rose 12.1 percent; primary metals increased 8.4 percent; and furniture and related products edged up 1.7 percent.
READ ALSO: Top 10 Emerging Industrial Markets
—Posted on May 27, 2026
January’s annual gains came alongside a steep monthly drop
January’s year-over-year increase suggested continued industrial demand, but the monthly decline was hard to ignore. New orders were up 3.5 percent from January 2025, adding $19.3 billion, based on U.S. Census Bureau data. Most major manufacturing categories advanced over the year.
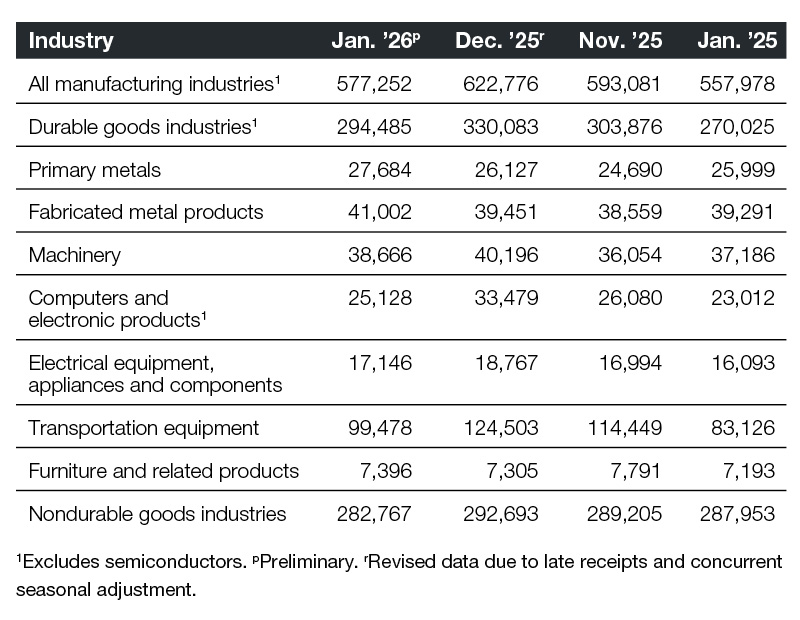
Transportation equipment led annual growth at 19.7 percent. Computers and electronic products increased 9.2 percent, and durable goods industries rose 9.1 percent. Primary metals and electrical equipment, appliances and components each gained 6.5 percent. Fabricated metal products were up 4.3 percent, machinery 4 percent, and furniture and related products 2.8 percent. Nondurable goods orders fell 1.8 percent, the only major category to contract over the year.
Month to month, total orders tumbled 7.3 percent, a decrease of about $45.5 billion from December 2025. Primary metals still managed a nearly 6 percent gain; fabricated metal products rose 3.9 percent, and furniture and related products increased 1.2 percent. The rest declined: machinery fell 3.8 percent, nondurable goods 3.4 percent, electrical equipment, appliances and components 8.6 percent, and durable goods 10.8 percent. Transportation equipment dropped 20.1 percent, while computers and electronic products posted the steepest fall, down 24.9 percent.
That split across the three reports is the takeaway: annual order growth was positive in January, accelerated in March and broadened further in April, yet the monthly readings swung sharply in both directions. For industrial property watchers, these figures offer evidence of manufacturing activity, but they don’t by themselves establish a durable trend in demand for space.
READ ALSO: Shallow-Bay CRE: Not Just for Industrial Anymore
—Posted on April 21, 2026
The post 2026 New Orders appeared first on Commercial Property Executive.