CMBS distress keeps climbing, with office loans setting the pace
The latest Trepp figures point to a slow but persistent deterioration in commercial mortgage-backed securities: the special servicing rate rose 7 basis points in September to 11.49 percent, its highest level since February 2013. That’s 84 basis points above a year earlier and 49 basis points higher than six months ago. The monthly increase is modest; the longer trend is harder to dismiss.
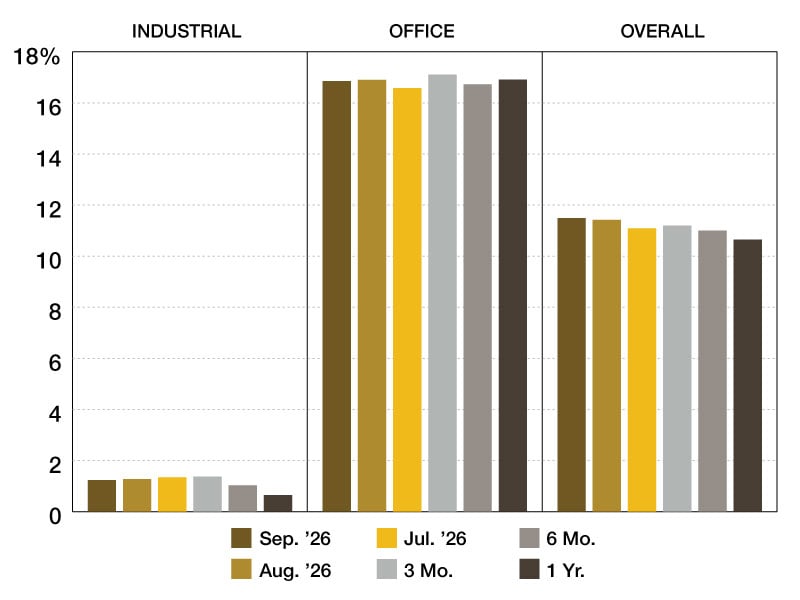
Office remains the clearest pressure point. It accounted for 57 percent of the $2.65 billion transferred to special servicing in September, even as its rate slipped 5 basis points to 16.85 percent. Retail rose 24 basis points to 13.84 percent, lodging gained 21 basis points to 8.95 percent, and multifamily increased 17 basis points to 8.54 percent. Mixed-use fell 30 basis points to 13.17 percent; industrial edged down 4 basis points to 1.23 percent.
Here’s the thing: transfers slowed by dollar volume, but that doesn’t mean the underlying strain has eased. September’s $2.65 billion covered 42 whole loans, down 13 percent from August’s $3.04 billion across 29 loans. Meanwhile, $1.95 billion across 48 loans left special servicing, up sharply from $579.7 million across 32 loans the month before. Of those exits, 18 loans totaling $1.00 billion returned to master servicers; the other 30, worth $953.5 million, had no remaining balance after payoff or liquidation.
The largest new transfer, One SoHo Square at $512.8 million, alone added about 8.5 basis points to the overall rate. The CMBS 2.0+ rate reached 11.42 percent, up 7 basis points, while the CMBS 1.0 rate eased 7 basis points to 61.89 percent. Only $500.0 million of the balance in special servicing is CMBS 1.0.
READ ALSO: CRE Lost the 179D Energy Tax Break. Where’s the Fallout?
—Posted on Oct. 22, 2026
August’s jump came from large transfers
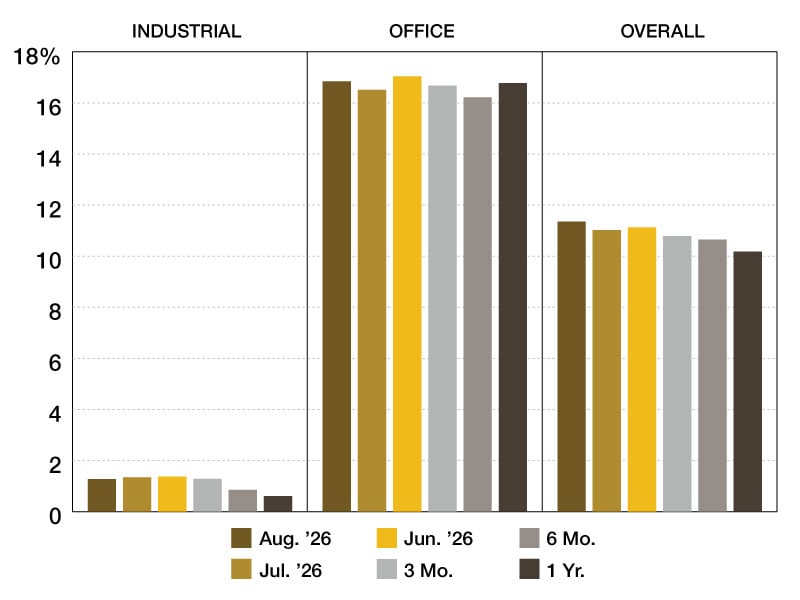
August’s special servicing rate rose 33 basis points to 11.42 percent, reversing July’s decline and matching the highest level since February 2013. A $1.10 billion Hollywood studio-and-office loan drove much of the mixed-use rate’s 154-basis-point jump, to 13.47 percent.
Office climbed 32 basis points to 16.90 percent, with large central business district loans contributing to the increase. Retail also added 32 basis points, reaching 13.60 percent as large mall and shopping center loans transferred. Lodging rose 11 basis points to 8.74 percent. Industrial and multifamily moved lower, by 7 basis points to 1.27 percent and 2 basis points to 8.37 percent, respectively.
Transfers totaled $3.16 billion across 32 whole loans, nearly twice July’s volume, and were concentrated in office. Several of the largest loans had exhausted extension options, a pattern Trepp had flagged in its August hard maturities report. Cures, modifications followed by a return to servicing, and payoffs amounted to roughly $500.7 million across 14 loans.
READ ALSO: 2026 CMBS Delinquency Rates
—Posted on Sept. 29, 2026
July brought a brief reprieve
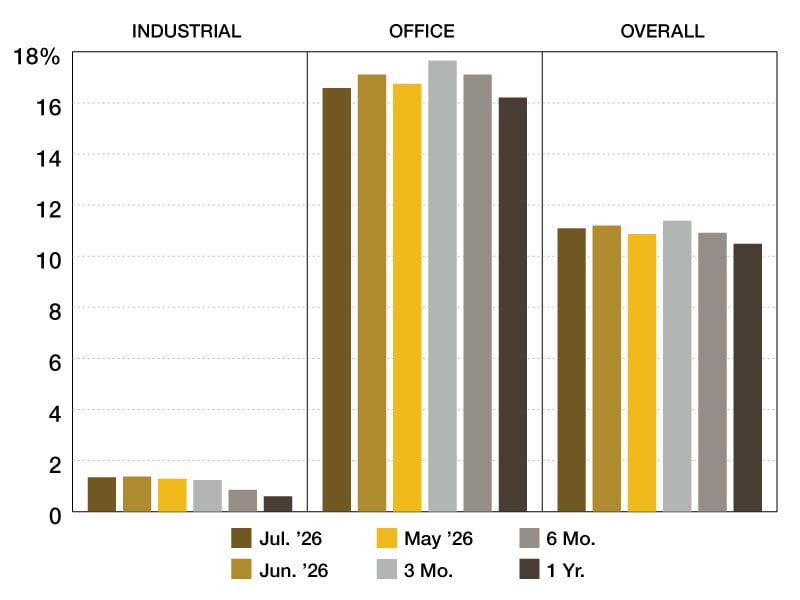
The overall rate fell 11 basis points in July, to 11.09 percent, offering a partial reversal of the preceding increases. Office, the largest category in special servicing, improved by 53 basis points to 16.58 percent. Lodging dropped 26 basis points to 8.63 percent, and industrial slipped 3 basis points to 1.34 percent.
That improvement had limits. Retail rose 33 basis points to 13.28 percent as a heavy wave of regional mall loans reached balloon maturities and transferred after maturity defaults. Multifamily increased 16 basis points to 8.39 percent, while mixed-use edged up 2 basis points to 11.93 percent.
New transfers came to about $1.69 billion across 41 loans, including roughly $903.6 million in retail. Regional malls reaching balloon maturities dominated the flow. Loans cured, modified and returned, or paid off totaled about $326.4 million.
READ ALSO: As Capital Returns, Which Office Deals Will Get Done?
—Posted on August 27, 2026
June transfers outweighed resolutions
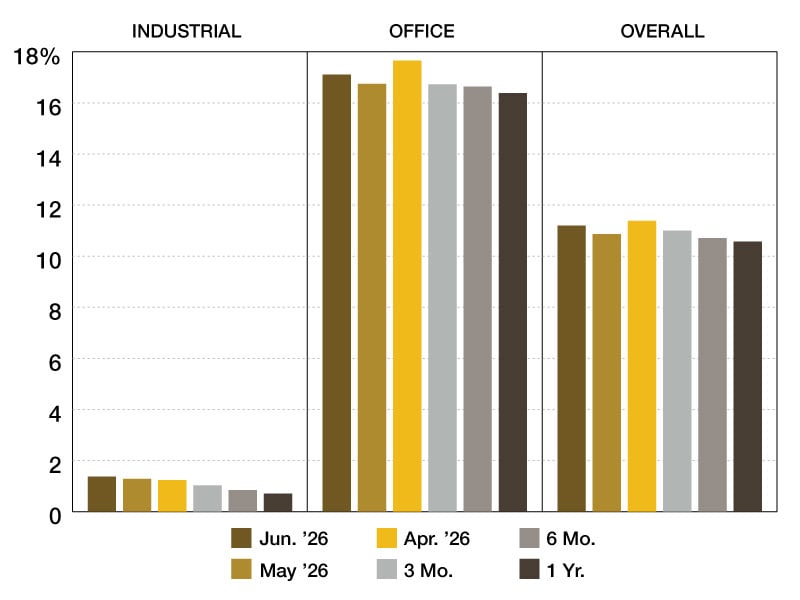
In June, the rate rose 34 basis points to 11.20 percent, reversing May’s drop. The main driver was a large volume of new transfers: about $3.08 billion across 42 loans, including a $975 million retail portfolio loan and a $430 million lodging loan. Cures and payoffs across 15 loans totaled roughly $1.16 billion, too little to offset the incoming volume.
Four of the six major property types posted increases. Lodging had the largest, up 44 basis points to 8.89 percent. Office rose 36 basis points to 17.11 percent, with several large transfers contributing; mixed-use gained 28 basis points to 11.90 percent, and industrial added 9 basis points to 1.37 percent. Multifamily improved most, falling 27 basis points to 8.23 percent, helped by the return of the large Yorkshire & Lexington Towers loan. Retail dipped 5 basis points to 12.95 percent.
READ ALSO: What the Quantum Computing Boom Means for CRE
—Posted on July 28, 2026
May’s decline owed much to one large loan
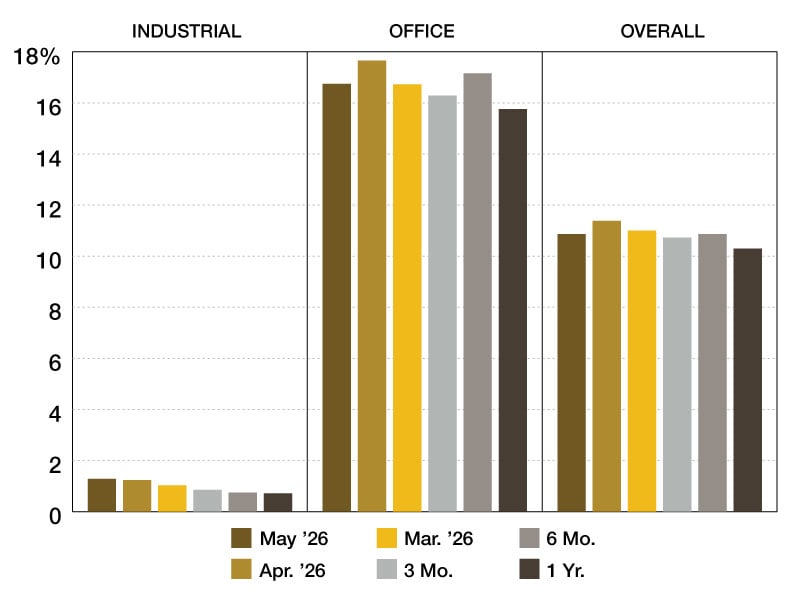
The rate dropped 51 basis points in May to 10.86 percent. A massive office loan returned to its master servicer, and the larger outstanding CMBS balance also affected the calculation. New transfers remained elevated, including several large office and retail loans, but resolutions and returns to master servicing outweighed them.
Most property types improved. Office fell 91 basis points to 16.75 percent, mixed-use declined 59 basis points to 11.62 percent, and multifamily was down 57 basis points to 8.51 percent. Lodging recorded the steepest decline, 121 basis points, to 8.45 percent. Industrial rose 5 basis points to 1.28 percent, while retail edged up 1 basis point to 13.00 percent.
—Posted on June 25, 2026
Office distress is setting the direction
Office loans are the clearest force behind the latest rise in CMBS special servicing. The overall rate reached 11.38 percent in April, up 38 basis points from March, as a wave of new office transfers outweighed several large office, retail and mixed-use loans returning from special servicing. That monthly increase is more significant than the headline alone suggests: loan movements in both directions are shaping the total, but new office cases are currently carrying more weight.

April’s increase was broad. Office rose 93 basis points, multifamily 33 and industrial 20. Lodging was up eight basis points, mixed-use edged higher by two, and retail held steady. The data shows the direction of each sector, though it doesn’t explain why individual loans transferred or returned.
March’s increase also came down to office loans
The rate climbed 27 basis points in March to 11 percent. Six large office loans pushed it higher, outweighing several sizable cures. Office increased 44 basis points and multifamily 45; industrial rose 18. Lodging fell 43 basis points, mixed-use dropped 30 and retail slipped nine.

February offered a brief counterpoint
In February, the overall rate eased 18 basis points to 10.7 percent. Seven office loans and three mixed-use loans moved out of special servicing, nearly offset by the transfer of one large retail loan. The sector figures underline how much a single loan can matter: retail rose 133 basis points to 13.09 percent, with one loan accounting for 120 basis points of the increase.

Elsewhere, mixed-use fell 118 basis points to 12.49 percent and office declined 82 basis points to 16.29 percent. Industrial was unchanged at 0.85 percent. Lodging rose 64 basis points to 10.01 percent, while multifamily added 16 basis points to 8.30 percent.
January’s transfers set the early-year pattern
January’s rate rose 20 basis points to 10.91 percent, with new office transfers leading the increase. Office had the largest sector move, up 47 basis points to 17.11 percent. Multifamily rose six basis points to 8.14 percent, and industrial was nearly flat, gaining one basis point to 0.85 percent. Mixed-use fell 30 basis points to 13.67 percent, retail dropped 23 to 11.76 percent, and lodging declined 11 to 9.37 percent.

New transfers totaled about $2.3 billion across 38 loans in January 2026. Office accounted for $1.33 billion across nine loans, nearly 59 percent of the total. Retail contributed $513 million across nine loans, or roughly 23 percent. Mixed-use represented $139 million across two loans; lodging, $108 million across five; and multifamily, $100 million across nine. Other property types made up the remaining $79 million across four loans.
For anyone tracking CRE credit, the takeaway is that the overall rate can conceal sharply different sector conditions—and that a handful of large loans can move the monthly reading. Trepp’s figures show office repeatedly pushing the total higher, even as cures and declines elsewhere provide some offset.
READ ALSO: Cap Rates Hold Steady Across Major CRE Sectors
—Posted on Feb. 25, 2026; March 24, 2026; April 23, 2026; and May 26, 2026
The post 2026 Special Servicing Rates appeared first on Commercial Property Executive.