Foreclosures are climbing again, and that's enough to make anyone planning a move hit pause. Here's the thing, though: the latest numbers describe a market that can absorb the uptick without flooding the street with cheap listings. Headlines about rising distress tend to travel faster than the data behind them, and the gap between the two is where most bad decisions get made.
Buyers hoping a wave of bargains is coming and sellers bracing for a wave of rivals are reading the same headlines and drawing the wrong conclusion. The data supports neither scenario. Both camps are working from a mental picture of the last crash, when distressed inventory swamped the market and pulled prices down with it. That picture isn't wrong, exactly, but it's a poor template for today.
A Rise From a Very Low Base
Completed foreclosures are up 33% from a year ago, according to ATTOM. That's a striking jump, but it's sitting on a small base. Completions are still about 26% below the first half of 2020. Percentage changes flatter whatever number they start from. A rise off a depressed level can look dramatic while the actual volume stays modest, and (this is the part most people overlook) the comparison to 2020 tells you more than the year-over-year bump does.
Zoom out to the crash and the picture gets clearer. Lenders completed about 28,000 foreclosures in the first half of 2026. During the crash, lenders often completed more than 200,000 in just a few months. The chart below shows crash-era volumes in red.
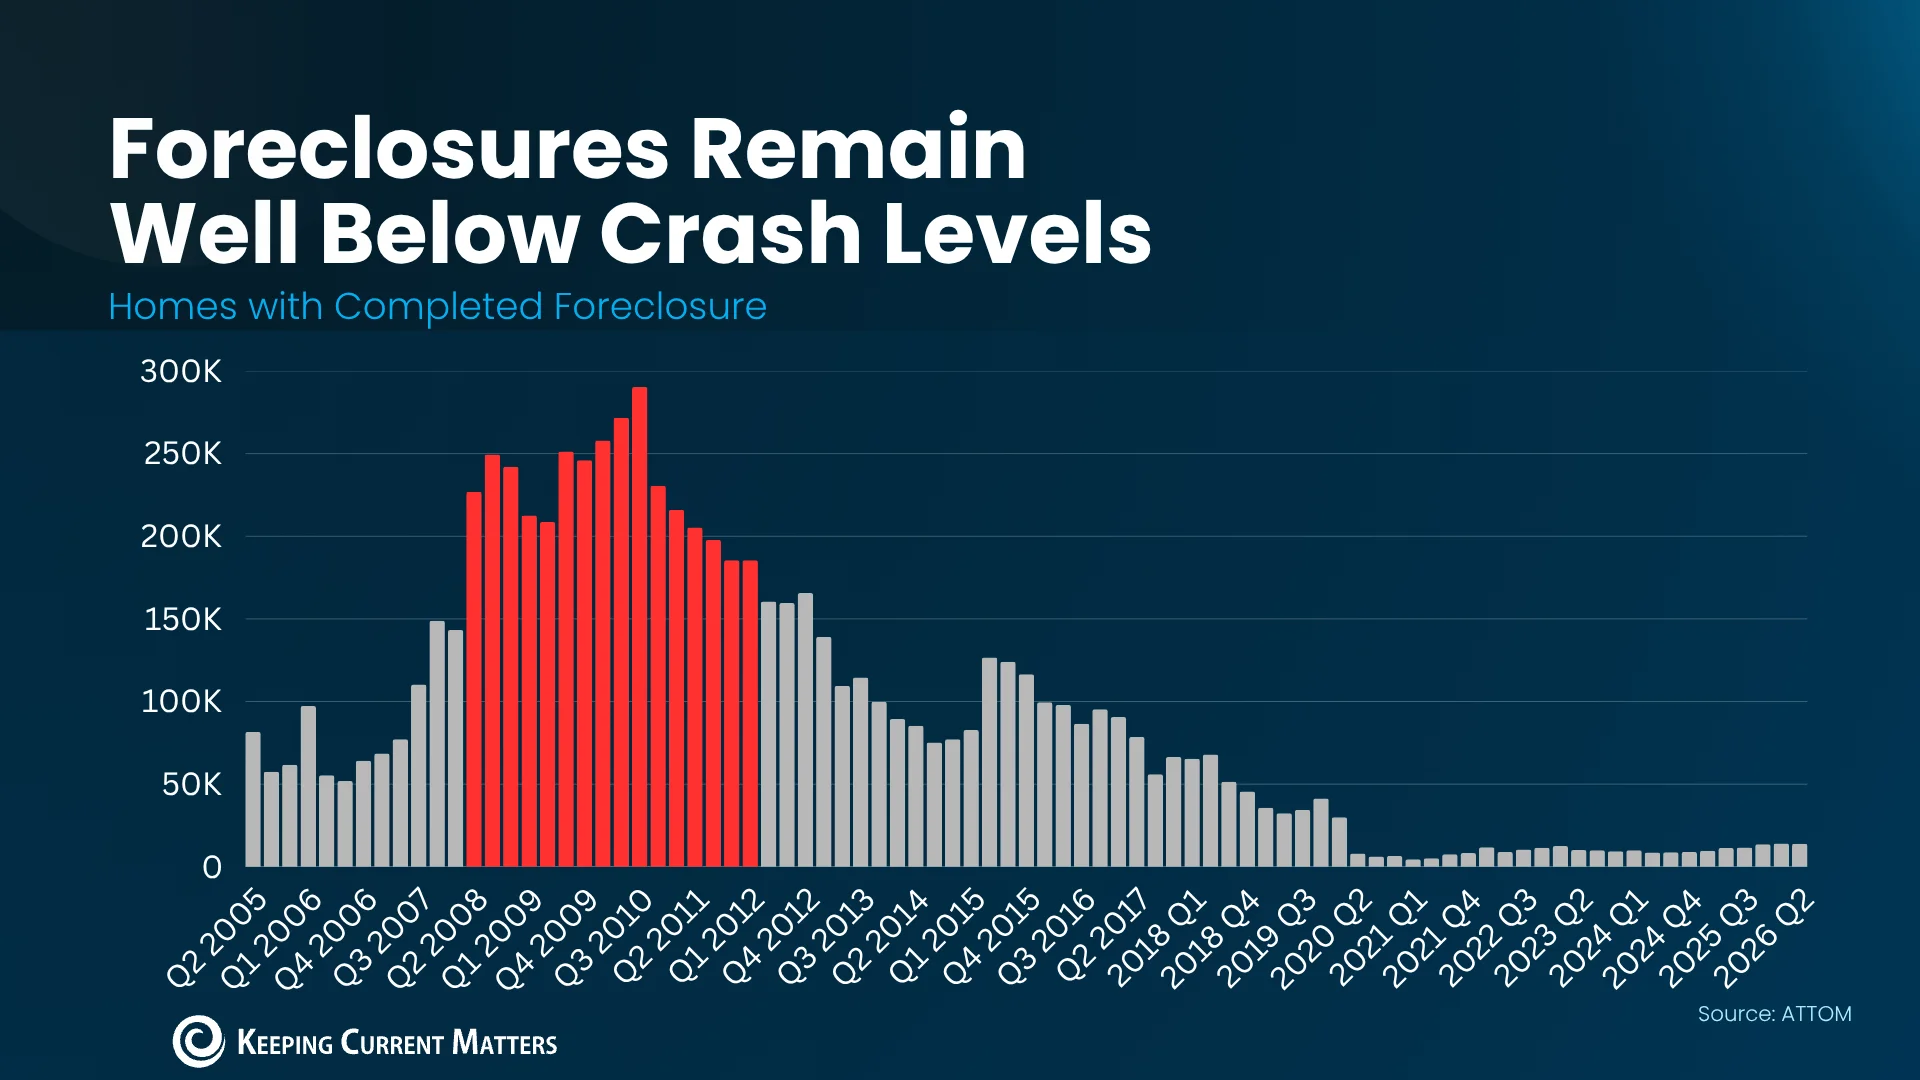
That gap is the whole story. Even a sharp percentage increase from here would leave volumes far below anything resembling the crash period. Foreclosure activity in similar systems typically moves in waves tied to broader economic stress, which means a single year-over-year jump tells you less than the trend across several years. If you're trying to judge whether this is a turning point, look at the multi-year line, not the headline percentage.
Rob Barber, CEO at ATTOM, sums up the situation:
“While some homeowners are still facing financial challenges, overall foreclosure volumes remain well below historical norms and the broader housing market continues to demonstrate resilience.”
Some owners are under real strain, and that matters in specific neighborhoods. Nationally, though, the numbers haven't tipped into distress. I'd read that quote as a hedge with a point. Barber acknowledges hardship but places it inside a broader market that's still holding. Local pockets can be severe for the families inside them while barely registering in national totals, which is why averages can mislead anyone looking at one particular city or block.
Inventory Never Piled Up
The last crash flooded the market because owners lost homes to foreclosure or sold under pressure. That isn't the setup today. Those two channels fed each other: forced sales pushed listings up, and listings pushed prices down, which made it harder for anyone underwater to escape. Today's market hasn't shown that loop, at least not in the inventory data, and that's the first thing I'd check before buying into a bargain narrative.
Months' supply is a useful gauge here. It measures how long it would take to sell every listed home at the current pace, and four to six months is generally considered balanced. The National Association of Realtors puts the current figure at 4.8 months, less than half its peak around the last crash. It's a blunt tool, since it lumps every listing together regardless of price or condition. Still, it's far better than eyeballing a few listing sites, and the direction it points is hard to argue with.
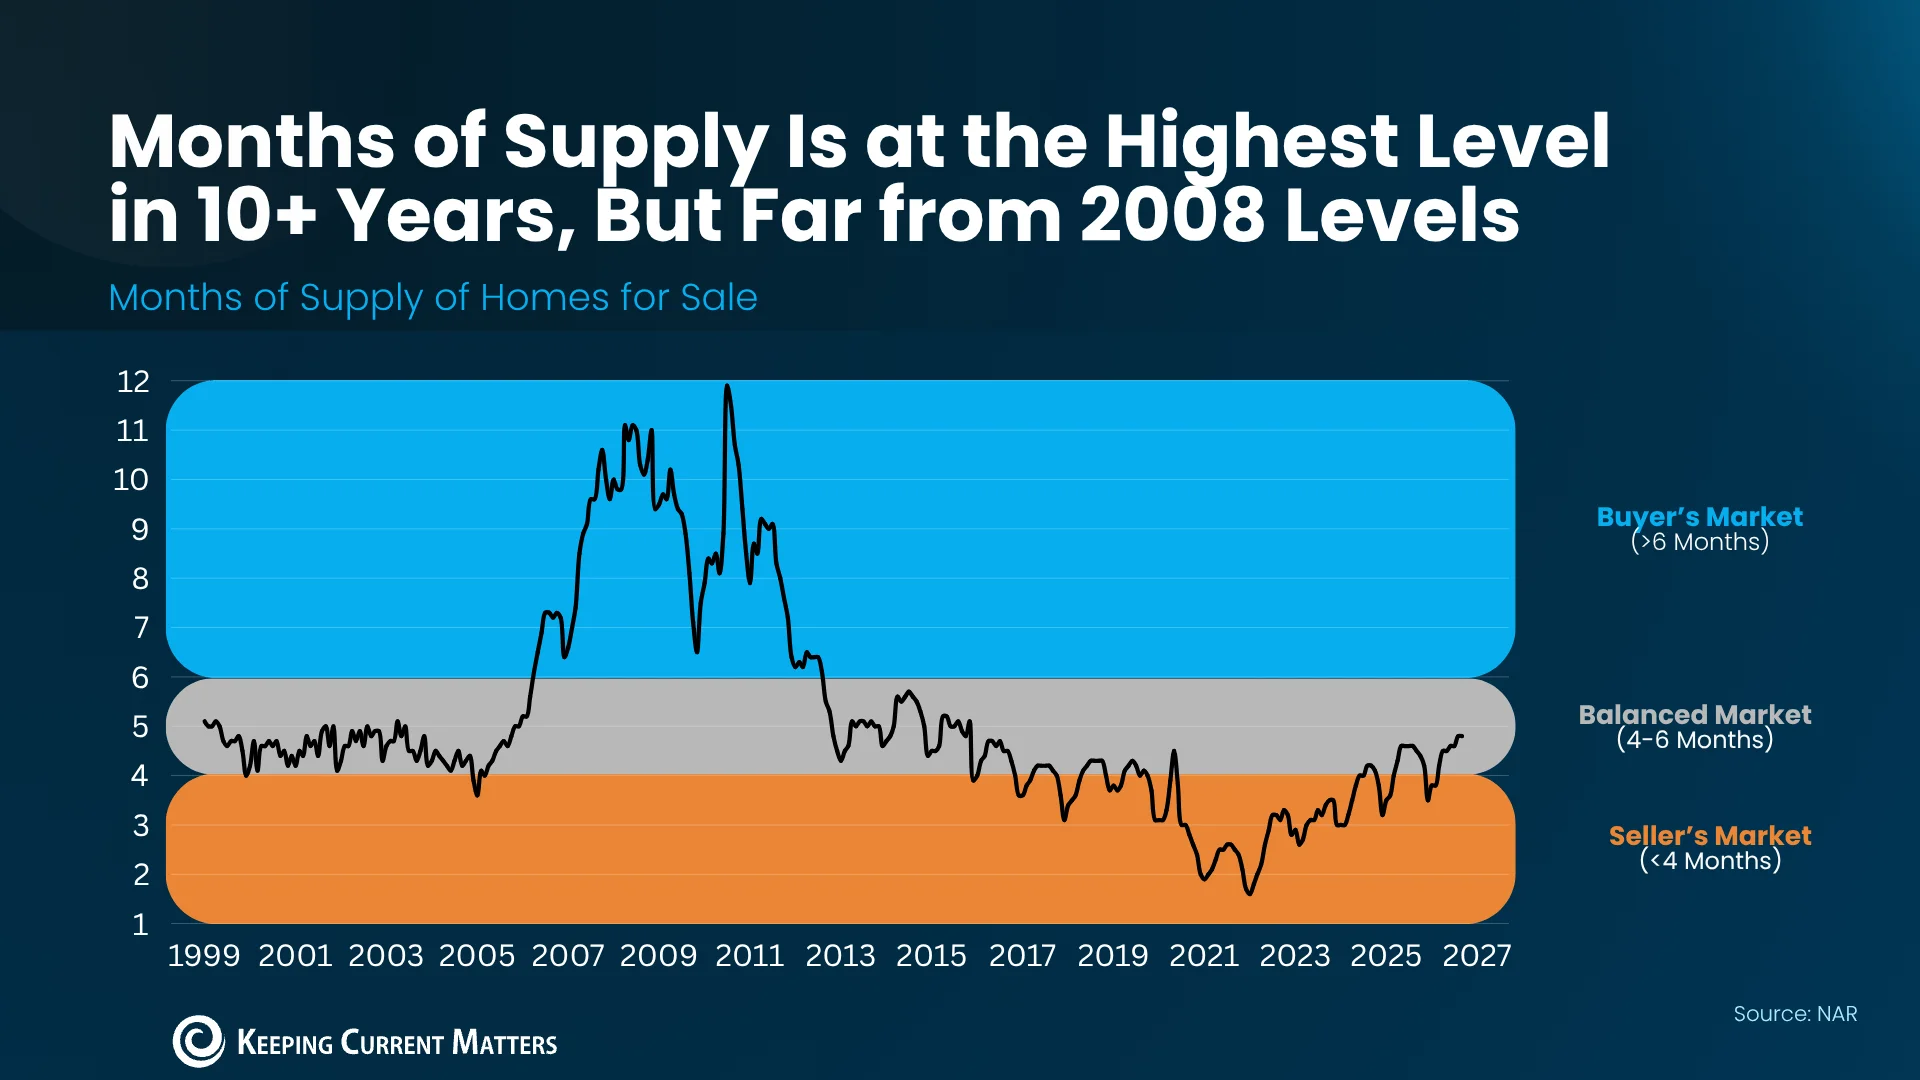
Logan Mohtashami, lead analyst at HousingWire, makes the inventory case directly: if foreclosures were truly surging, listings would show it.
“. . . a surge of actual foreclosures in 2026 would have easily put the inventory data much higher in 2026.”
Think about the mechanics. A foreclosed home doesn't vanish once the lender takes it back. It eventually gets sold, and those sales show up in the counts. That's why Mohtashami's argument works: if the volume were there, it would be visible in listings. The inventory figures don't show it, and that's a stronger signal than any single foreclosure statistic.
Equity Is Doing the Heavy Lifting
Census Bureau and ATTOM data show nearly two in three homeowners have either paid off their mortgage or hold more than 50% equity. Cotality puts the average homeowner's equity at about $310,000. That's the main reason distressed sales aren't surging. A cushion like that is hard to overstate, because it gives most owners a way out before a missed payment turns into a lost house.
Equity changes the exit options. A homeowner who hits a rough patch can usually sell, pay off the loan and keep what's left, rather than losing the house. Many owners didn't have that route during the crash, when falling values wiped out cushions quickly. According to HousingWire, nearly one in four homes were underwater back in 2010. That's the contrast that matters: today's owners are mostly holding assets they can sell, while many owners of that era were holding liabilities.
Underwater means owing more than the home is worth, which makes selling very hard. It's a blunt label, but it captures the trap well. Once you're underwater, the sale doesn't clear your debt, so you're stuck until prices recover or you bring cash to the closing table. Today, just 2% of homeowners are seriously underwater. Two percent is a small slice, and small slices can still hurt the people inside them, but it's a far cry from the crash era.
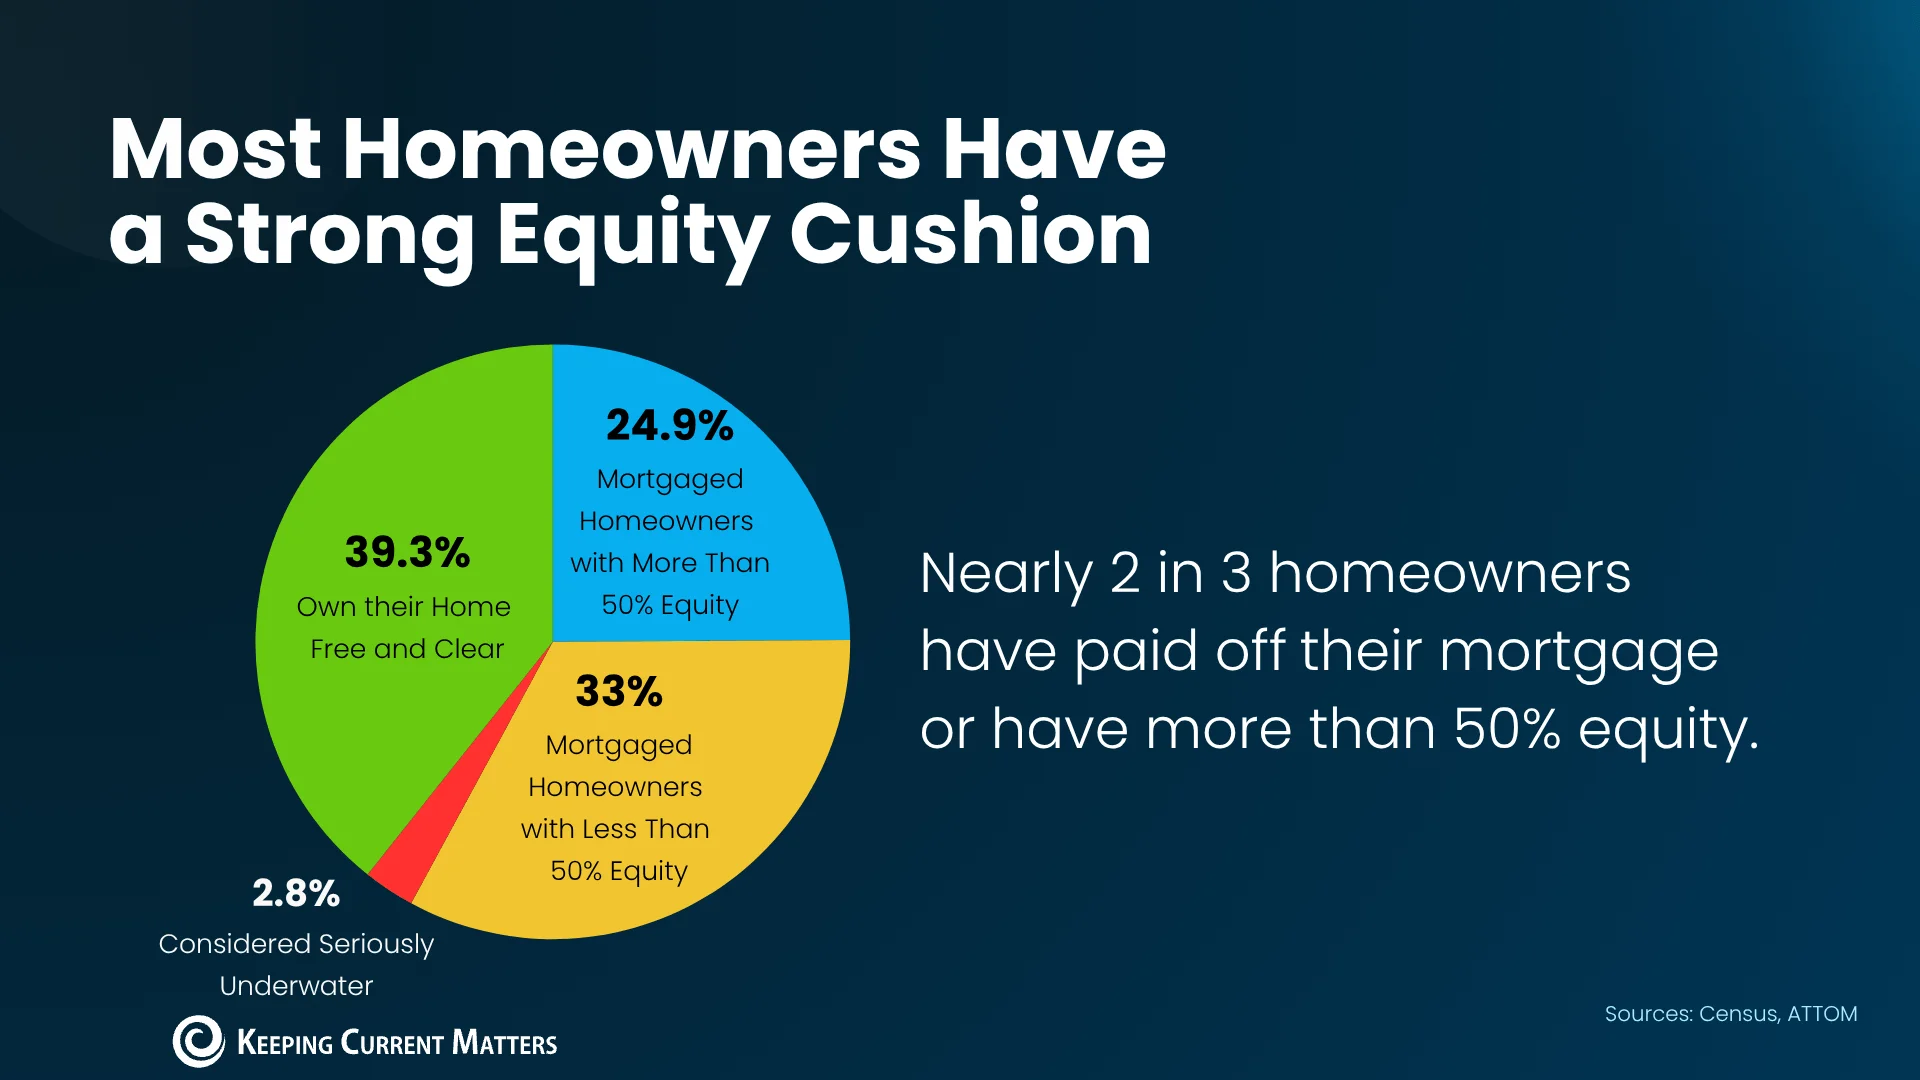
Not every owner has a cushion, but most do. That's what caps how high foreclosures can realistically climb. Equity isn't evenly spread, though. Owners who bought recently, at high prices, with little down payment are the ones most exposed, and they're often concentrated in particular markets. A national average can look comfortable while those pockets struggle.
What This Means If You're Buying or Selling
If you're shopping for a home, don't expect a fire sale. Distress in specific neighborhoods might produce deals there, and that's worth tracking. But that's a local story, not a national one, and the inventory data doesn't point to a wave of cheap listings across the board. Treat any bargain narrative with suspicion until the local numbers back it up.
If you're selling, the rival wave is also overstated. Rising foreclosures don't automatically flood your street with competing homes, because the inventory data hasn't moved that way. That said, local conditions still matter, and a neighborhood with concentrated stress can behave differently from the national average. Know your market before you assume the national picture applies to your block.
This is more significant than it looks. The foreclosure headlines are real, but the story underneath is about equity, low inventory, and a gap between local pain and national stability. Here's what would change my view: months' supply climbing back toward its old peaks, or equity cushions shrinking across a broad share of owners. Either would signal something different. Until then, this looks like scattered local strain, not the start of a slide. Not a crash. Not yet.